
Discover more from PharmaFiles by Aussie17
This is still a developing story because the data was only dropped a few hours ago. So there may be corrections etc.
But here are the key points as of now.
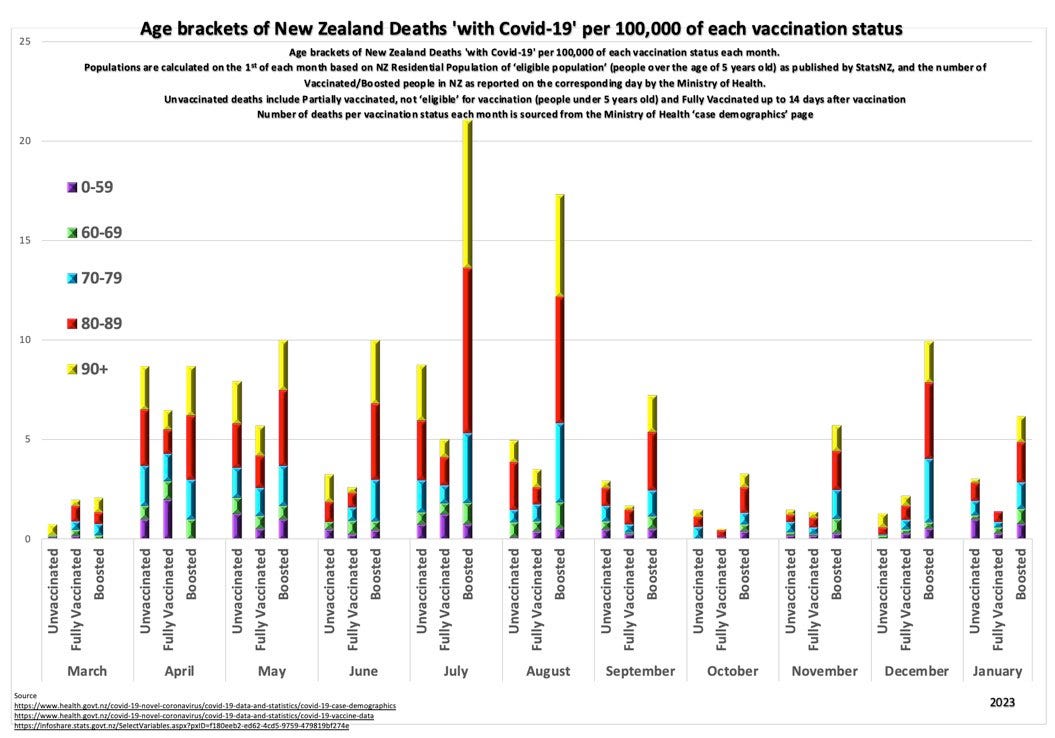
The above graph shows the number of COVID-19 Deaths by Age and Vaccination Status - the red bar shows COVID Deaths of boosted patients.
But since 72% of the population is boosted, the other side will argue that the majority are boosted, which is why the number of deaths is higher (i.e. base rate fallacy). Also note that I simply took a screenshot from the official government site.
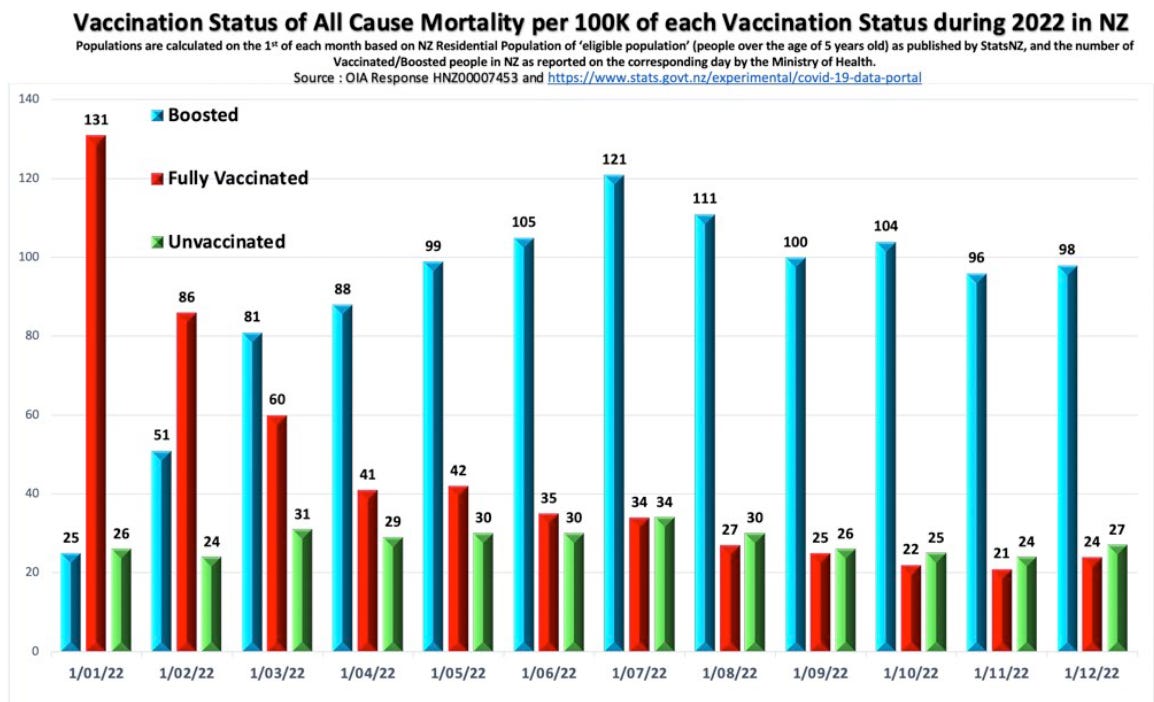
But if we look at the All-Cause Mortality data per 100K of each vaccination status, we can see that the blue bar (boosted) started outpacing from March 2022 onwards. Within the last six months of 2022, boosted patients died almost four times compared to the unvaccinated and fully vaccinated.
It looks like the Booster was the Kill Shot!
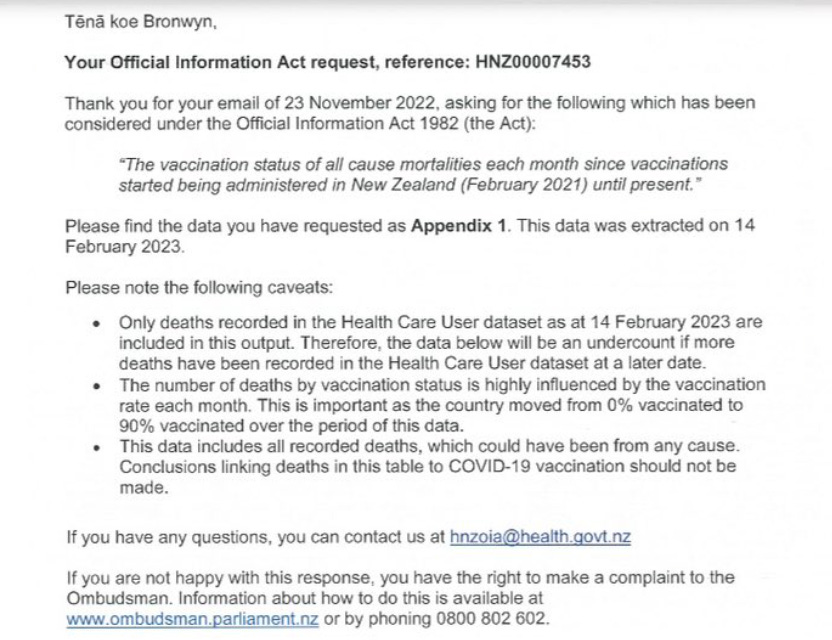
Source (@Bronwyn_Meikle) who requested the data through Official Information Act request. These were not officially published in Stats NZ.
(Update: Please read pinned comment on this data).
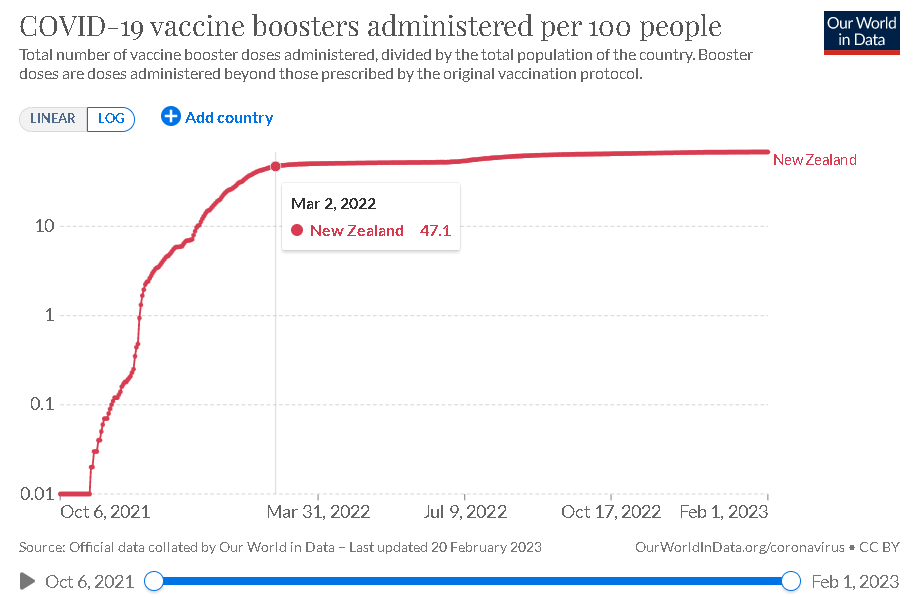
The NZ Booster campaign officially started on Oct 6, 2021, and peaked around early March of 2022, which is in alignment with the increasing rate of Boosted deaths.
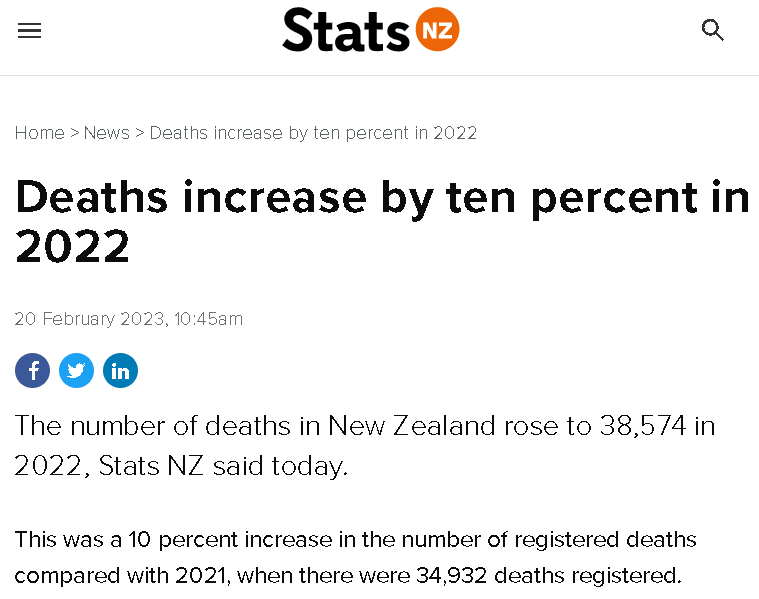
Total Deaths increased by 10.5% in 2022.
This is the most significant jump ever in the last ten years, surpassing double digits for the first time! What happened? In fact, during the worst year of the Pandemic, when we did not have the life-saving vaccine, deaths decreased by 5.1%.
(Correction: most significant jump ever in the last 100 years)
(there are some small discrepancy in the total death 38,652 vs 38,574 which is 10.3% instead of 10.5%. One from raw data source and one from published report. There are always some minor discrepancies when the data is freshly out of the oven)
There will be more analysis and insights to come in the following days. And also have data drops from Australia and Singapore in the coming days (and many more countries, but these are the ones I am monitoring). As I said, from February onwards, the data drops! We will have lots of new insights into the “life-saving experimental vaccine”!
Signing off for now,
Aussie17




@Aussie17,
1. I think @Bronwyn_Meikle 's all cause mortality rates per 100k are wrongly calculated - I suspect she has not adjusted the respective population denominator totals to reflect the shifting totals caused by the booster rollout. (I am waiting for her to reply to my DM)
2. IMO mortality rates by vaccination status not adjusted for age is simply not a meaningful metric. (see my other comment below)
3. As a large part of your post is based on a supposed correlation between the booster rollout and an inflection in the vaxxed:unvaxxed all cause deaths ratio, I think you really need to clarify the data for those rates you are basing your correlation on.
4. IF there is a significant shift in the ratio of vaxxed:unvaxxed deaths in Q1 2022, it is important to note it would also correlate with the rise of Omicron BA.2 to dominance in NZ.
Thanks for bringing this to our attention. It seems it should be a huge story, but I'm sure it will be buried by the mainstream media. Yet another data point proving the "unvaccinated" were right all along.